Marshmallow Miles
A market disrupting insurance offering that rewards customers for driving well

Overview
Marshmallow is a UK insurtech making insurance more accessible and fair, using tech and data to improve pricing and customer experience.
Traditional car insurance struggles to price younger drivers fairly while managing risk. Marshmallow needed a way to offer more accessible cover to younger customers in order to increase market share without increasing loss ratio.
Roles
- Lead product designer
- Product strategy
- User research
- Service design
Duration
10 months
Approach
We created Marshmallow Miles, one of the first app-based motor insurance products in the UK. The product uses driving behaviour to reward safe customers with renewal discounts while actively reducing exposure to higher-risk drivers. I led a small cross-functional product team from initial design sprint through to beta launch within six months.
Impact
-
Increased market share among 21–30 year-old customers (+27%)
-
Improved initial loss ratio, a core measure of insurance profitability (Claims paid/premiums earned) -1.3%
-
Improved our sign up conversion rate (+11%)
-
Increased customer retention through new rewards offering (To be determined)
Proposition & Vision
We begin with a week design sprint to map out possible strategies that could help mitigate risk for the business. We decided to focus on the app based cover concept as this was a differentiator to other insurers in the industry. If done successfully this would open up to new segments and increase our market share with younger drivers.
The early customer proposition
App based cover that rewards you for driving well.
Project vision
Find and keep low risk customers whilst removing dangerous drivers early through smart monitoring capabilities.
Discovery approach
Stage 1
-
Market and competitor analysis into telematic product
-
Researching engagement approaches to build safer driving behaviours
-
Stakeholder discovery workshop to gather requirements & explore problem space
-
Ran 12 initial user interviews with existing and potential customers
-
Concept testing the Marshmallow landing page
Stage 2
-
Feature journey testing
-
Diary study with competitor app with the new customer segment of 17-25 year olds
-
Design workshops
Industry research: Building safer driving habits


Early findings
We concept tested a future Marshmallow Miles landing page to understand users expectations and potential challenges.
-
General comprehension of the product and how it works
-
Any concerns around privacy or sharing data with their insurer
-
If the rewards proposition was really a true influence on their decision to purchase


Programme overview
To setup our new insurance offering multiple areas of the business needed to work closely across the following touch points.


Building core functionality
As the product research continued we started to build out the core features of the product that would be required for MVP. These features needed to be validated with users whilst we looked into who we could partner with from a data perspective to help create a reliable driving data model. This model was crucial in accurately estimating the risk of drivers.
Main user journeys
Web landing page
Customer acquisition
(Sign-up)
Onboarding in the app
Driving score & coaching
Rewards & Loyalty
Step 1: Customer sign-up
This is the journey a new customer will go through to purchase miles insurance


Key metrics within the growth team tracked across the sign-up funnel
+23%
Click through rate
(From aggregators)
+8%
Net conversion rate
+7.1%
Cancellation rate
(3.6% standard)
Step 2: App onboarding
One of the most complex journeys to design and optimise was for setting users up in our app to share their necessary permissions to ensure we can track their drives accurately.


96.8%
2.2%
Successful onboarding rate
(Under 24 hours)
Start a live chat to get assistance
14s
Avg time to complete
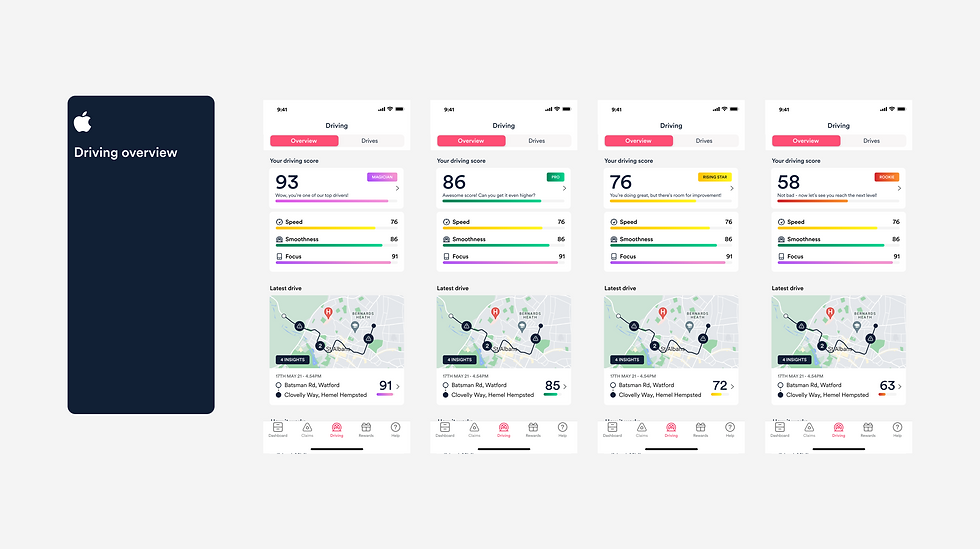
Step 3: Driving score
After their first drive the user will receive a score out of 100 based on three parameters speed, smoothness and focus (phone use). Depending on the drivers score at the point of renewal will qualify them for a renewal discount.


Improvements made post launch included:
-
Recency bias to help accurately reflect their current driving risk level
-
Ability for users to see drives we have detected as a passenger
-
Visualising their drives and improvements on a map route
-
Weekly round-ups to increase engagement and mindfulness of improving
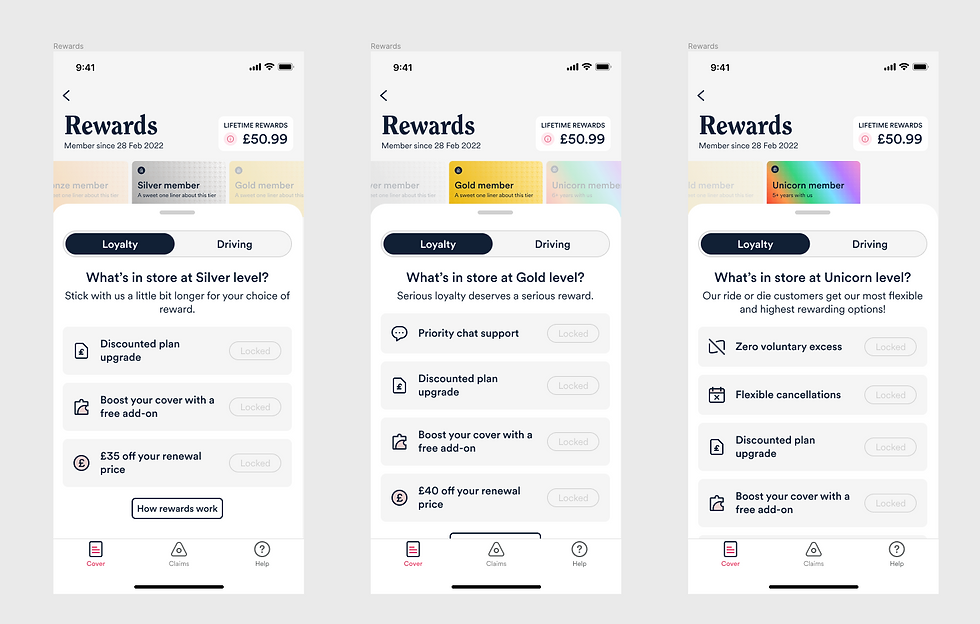
Rewards & Loyalty approach
We aimed to attract new customers and explore long-term loyalty by offering upfront and renewal incentives. Key focus areas include cross sell discounts, enhanced loyalty over time, and discounts at renewal.
-
Offer a 5% upfront discount and up to £100 at renewal to drive traffic via comparison sites.
-
Assess annual budget per miles-based customer and allow users variety through partnerships
-
Ensure loyalty programmes grow in appeal over time to increase customer lifetime value (LTV).
-
Focus on providing real, tangible value to customers through all rewards and incentives.


Service design (Operations)
Worked with operations to set up and prioritise workflows for key driving alerts. Through workshops, we created eight workflows across operations, fraud, and underwriting to ensure all aspects of new customers were reviewed and tracked.


Our main achievements
-
1000 policy to 1 full time agent was the initial KPI target, after our first beta month this read 10 agents per 1000 policies to review and needed improvement
-
Reducing sensitivity of alerts helped reduce their numbers and allowed agents to increase the number of dangerous driving events they could review
-
Improved product and email comms to customers to improve self service within the app and improve comprehension of the product plan
Product launch strategy
We wanted to de-risk our launch to mass market and learn as much as possible to improve the product and processes. Our primary metrics to monitor were:
-
Driving score weighting
-
Accuracy of drives recorded
-
Flagging thresholds for dangerous driving
-
Comprehension of their insurance plan (Cancelation rate)
-
Operational workflows and SLA's
Staged release plan
Testing and design reviews
Beta launch to 1000 new customer (21-30)
Review claims impact & customer mix
Internal alpha launch (40 users)
Release to full market 30+
Learnings
Driving score weighting
-
Increased the weighting of smoothness as we found out this had the highest effect on their driving score along with phone handling (0.4,0.4,0.2)
-
Introduced a recency bias to better reflect their current level of risk
Accuracy of drives recorded & alerts thresholds
-
Provided features to allow customers to send a request if they felt their drive was scored incorrectly to help reduce negative reviews
Comprehension of their insurance plan (Cancelation rate)
-
Improved content within the sign-up flow and intentional friction to ensure customers were clear on the type of insurance they were purchasing to reduce cancelation rate
Final product overview
Sign-up & Purchase


Core app features

Driving insights widget
We built out a driving score widget as a way to increase awareness of their driving score to try and drive more awareness and engagement with safer driving.
-
18% of customers downloaded the widget within 4 weeks
-
Of those customers 28% improved their driving score post download


Customer feedback (Month 3 survey)
We sent out feedback surveys at month 1 and 3 to our initial customers to understand first hand how they were finding their insurance cover.


Overall impact
We managed to successfully find product market fit and establish a scoring model that accurately reflects the customers risk profile, however there were many learnings along the way.
Business impact (After 6 months)
27%
-1.3%
11%
4%
Increase in % customer 21-30 on cover
Improved loss ratio
Increase in sign up conversion
Increase in cost to serve (Per customer)
Product impact (After 6 months)
88%
61%
Accept push notifications
Weekly active users
(Vs 12% standard users)
29%
Increased driving score by one level
(E.g 70 to 80, within 3 months)
Comprehension & Cancelation challenges
Underestimated the difficulty of explaining a greenfield type of insurance to a majority of migrant based customers that were not familiar with this. Therefore leading to higher initial cancelation rates which we later managed to reduce by switching customers over to standard plans.
Lack of operations oversight
Our flagging criteria for dangerous driving was fair to strict which create thousands of alerts that needed to be manually reviewed by the operations team. We slowly reduced the sensitivity of these and built automated responses and filtering into our agent portal.
Driving score errors & edge cases
There were drives that were incorrect and rightly customers complained and lost trust in the product. We begin to automatically remove passenger drives and give users the chance to reach out to update their profile.
Key learnings